From 1 s count rates measured when the satellite was uniformly rotating around
Z axis, it was straightforward, after taking into account small variations in
the speed of the rotary table and offsets in the origin of the azimuthal angle
(which was fixed to correspond to LS4 axis) and after background subtraction, to reconstruct the angle
dependency of the shield efficiencies in the GRBM and AC bands at the various calibration energies. In
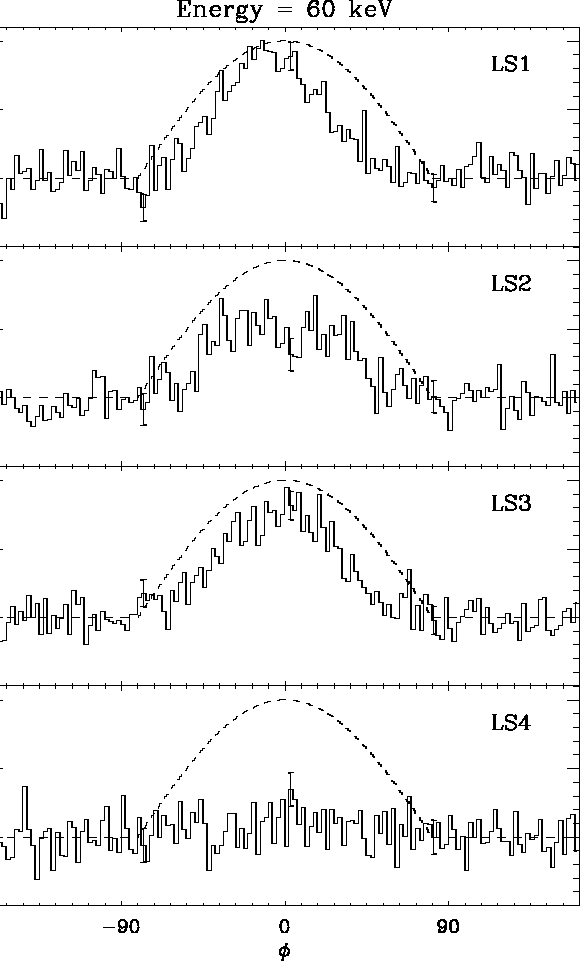
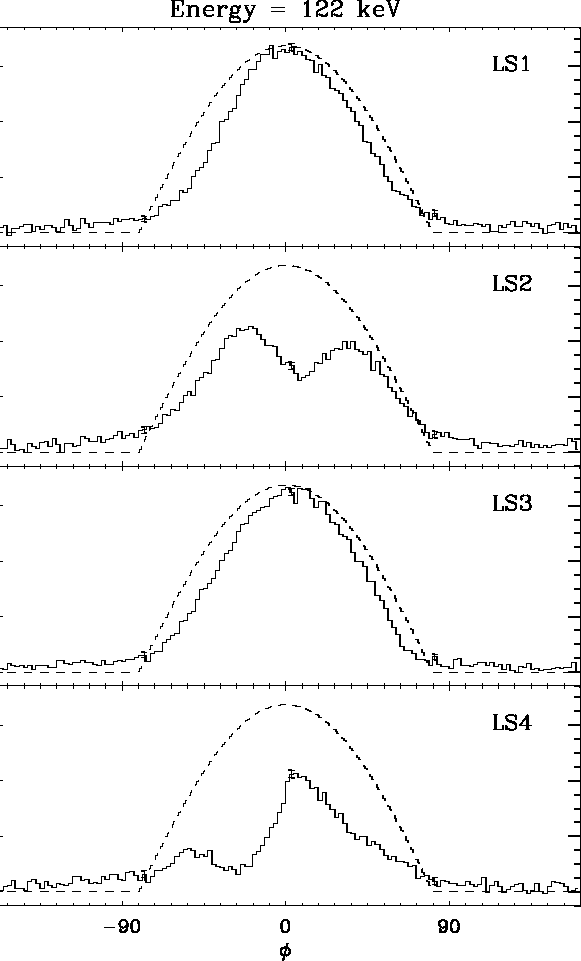
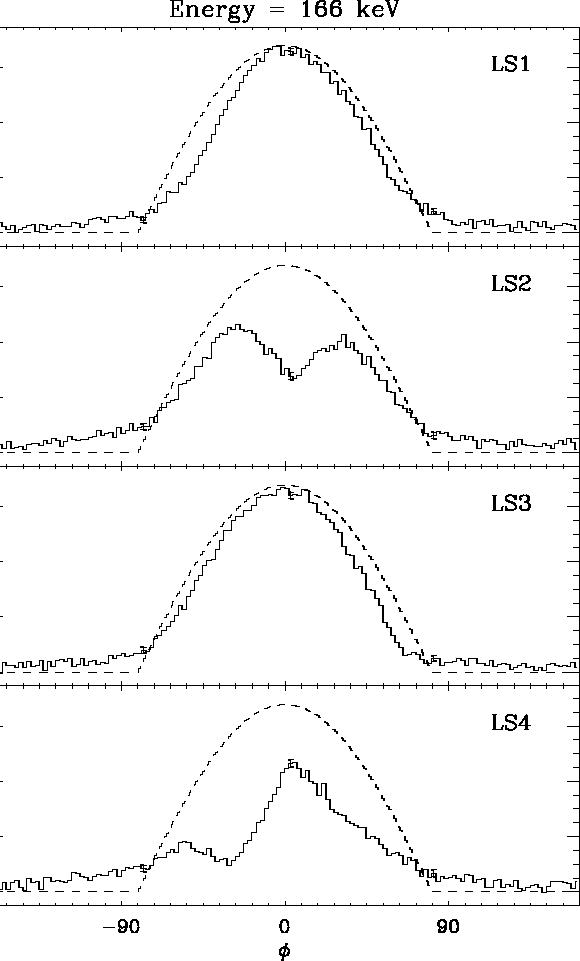
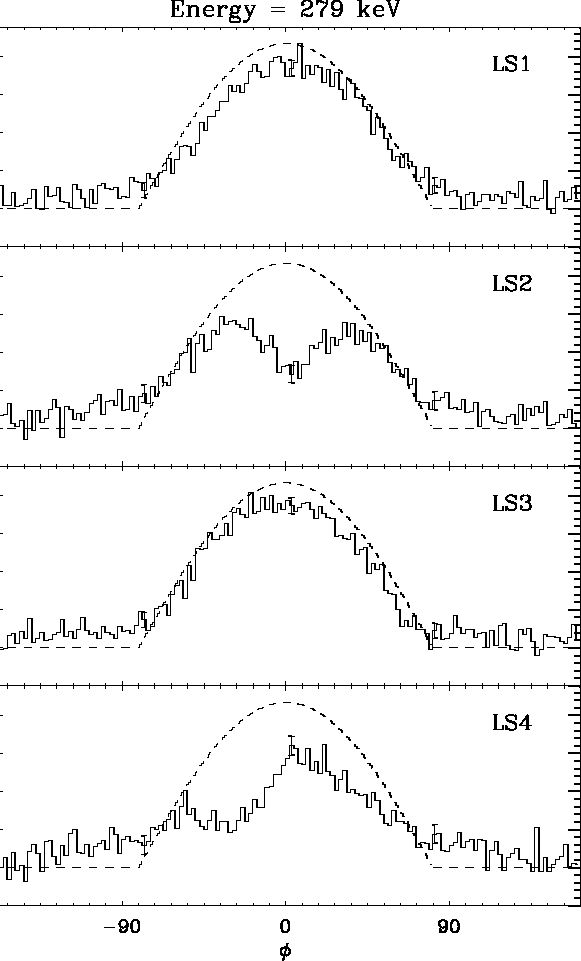
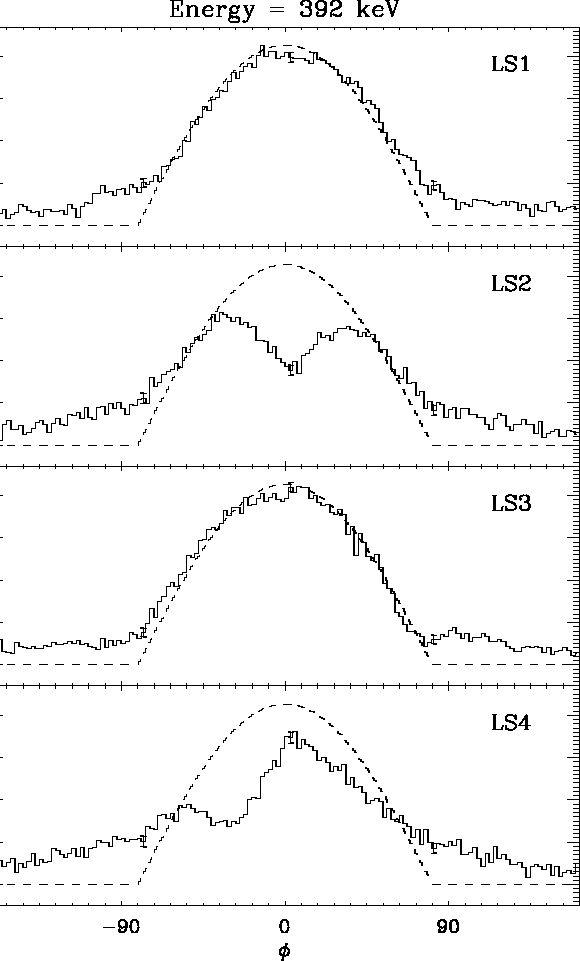
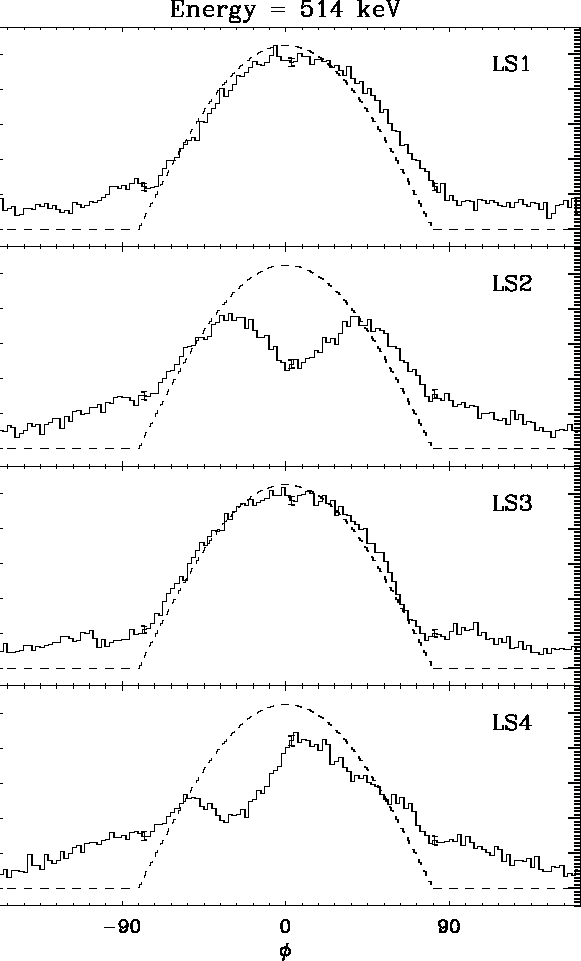
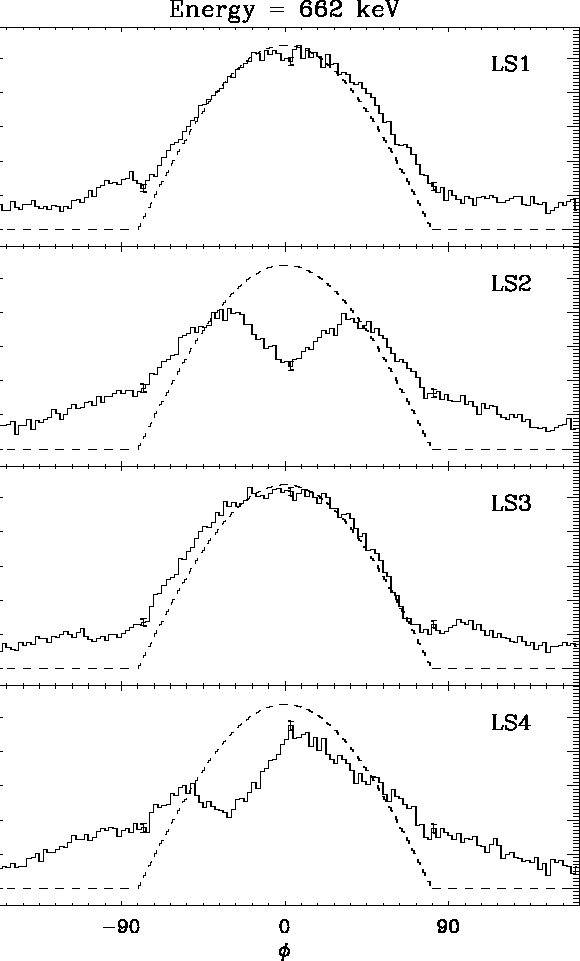
figures from 2.4 to 2.10 we show the GRBM band counts dependency on ![]() for
each LS at each calibration energy and with sources positioned
at
for
each LS at each calibration energy and with sources positioned
at ![]() =
=![]() . The change of the GRBM band
. The change of the GRBM band ![]() angular curves with
angular curves with ![]() is
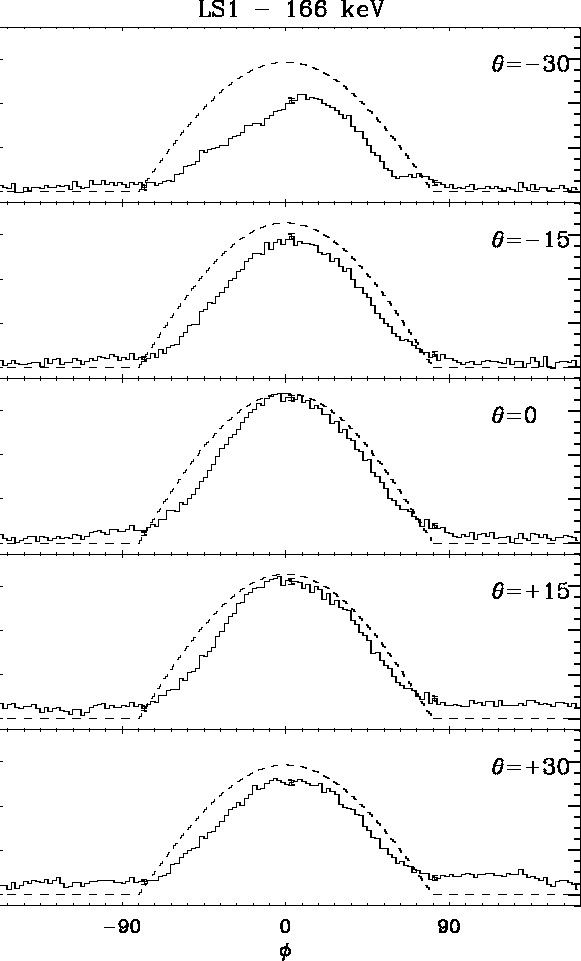
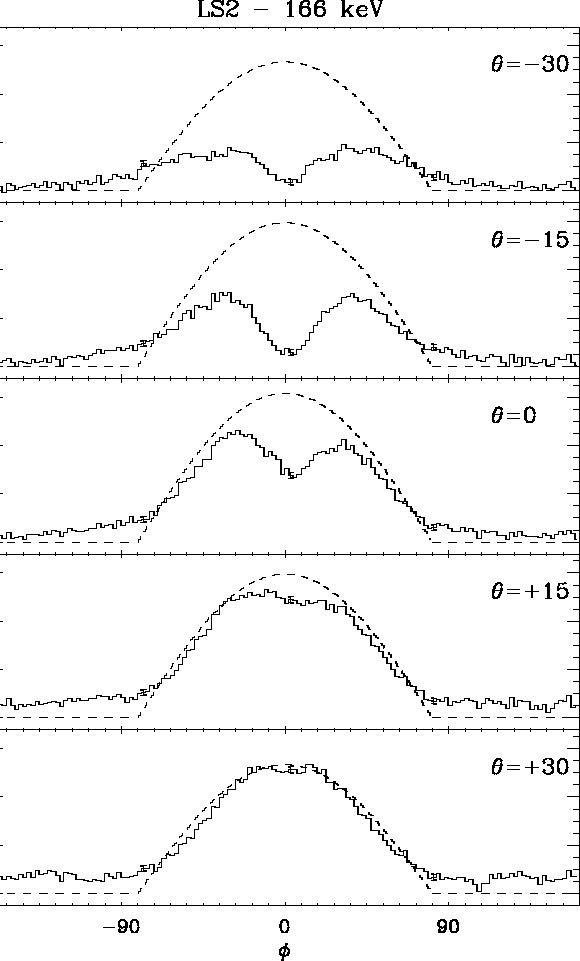
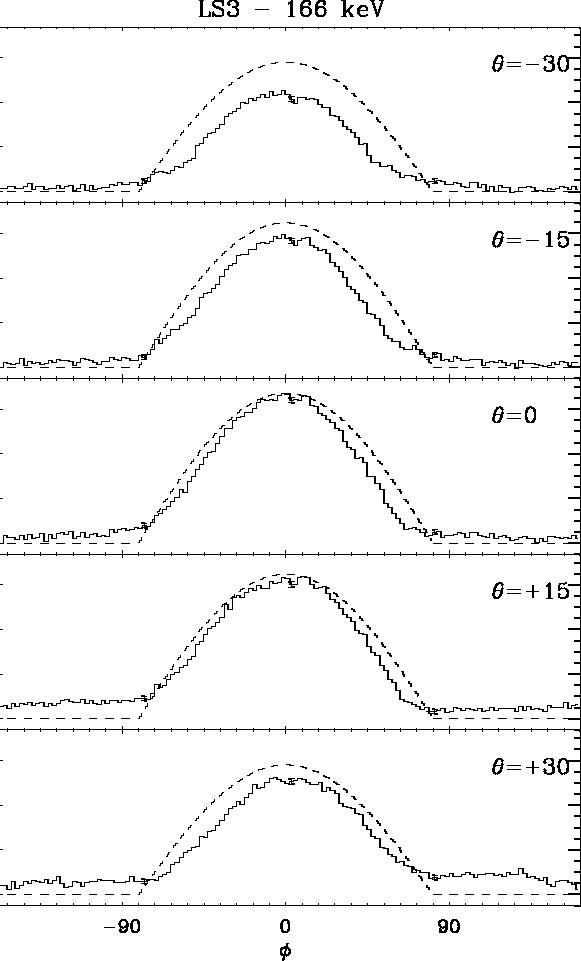
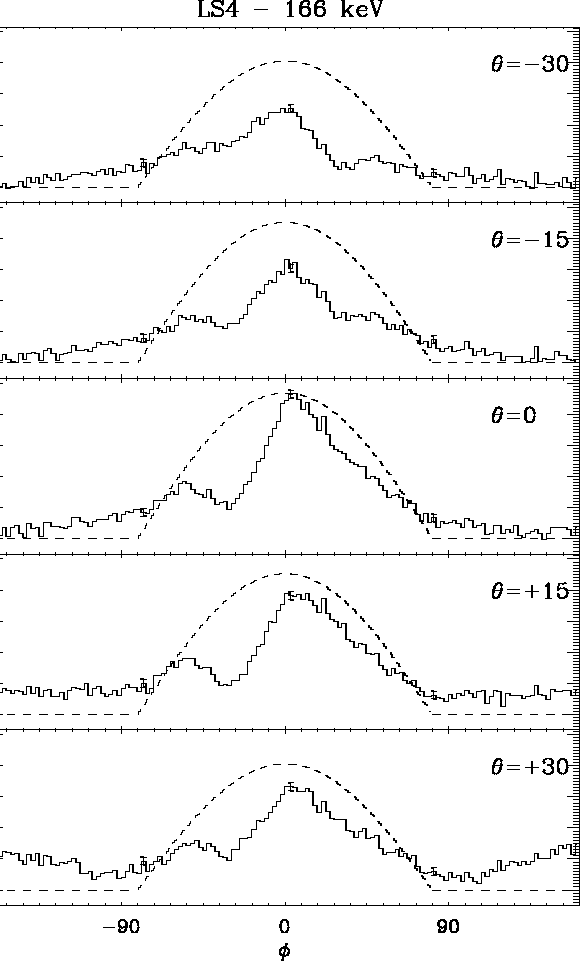
shown in figures from 2.11 to 2.14 for each detector at the calibration energy of 166 keV.
It is evident the increasing of LS2 efficiency at
is
shown in figures from 2.11 to 2.14 for each detector at the calibration energy of 166 keV.
It is evident the increasing of LS2 efficiency at ![]() between -90
between -90![]() and
+90
and
+90![]() as the elevation angle increases and the HPGSPC exits from its
field of view. Also we notice that LS1 and LS3 efficiency dependency on
as the elevation angle increases and the HPGSPC exits from its
field of view. Also we notice that LS1 and LS3 efficiency dependency on ![]() remains uniform and close to the co-sinusoidal shape also at non zero elevation angles, except for LS1 light curve at
remains uniform and close to the co-sinusoidal shape also at non zero elevation angles, except for LS1 light curve at ![]() =-30, in which there is evidence
of an important shielding effect at
=-30, in which there is evidence
of an important shielding effect at ![]() ..
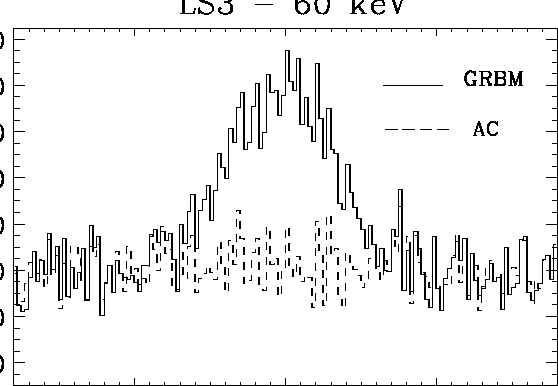
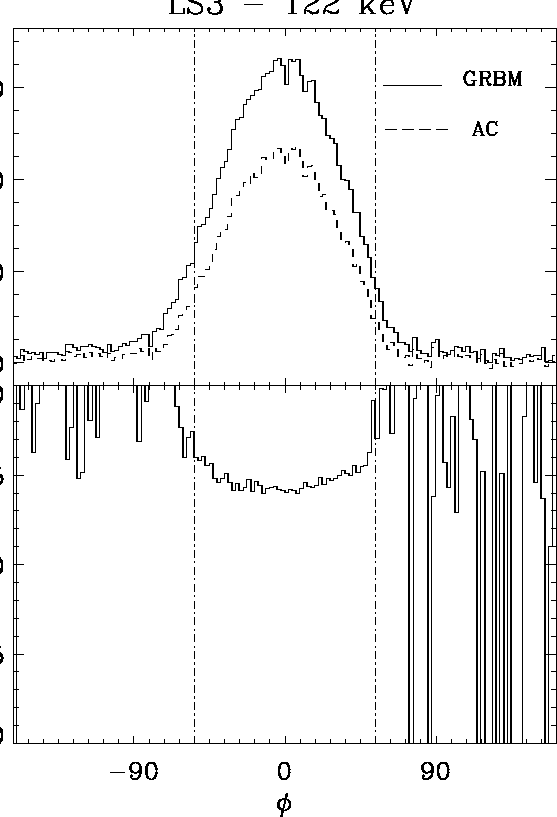
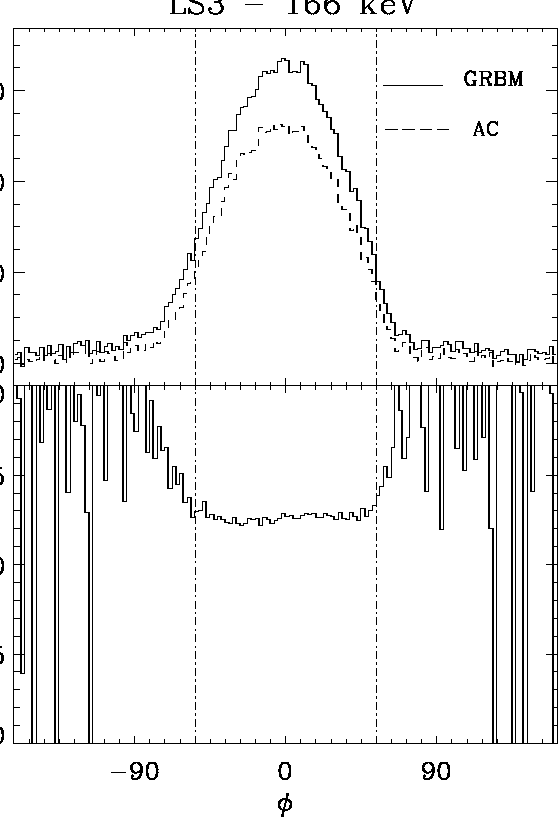
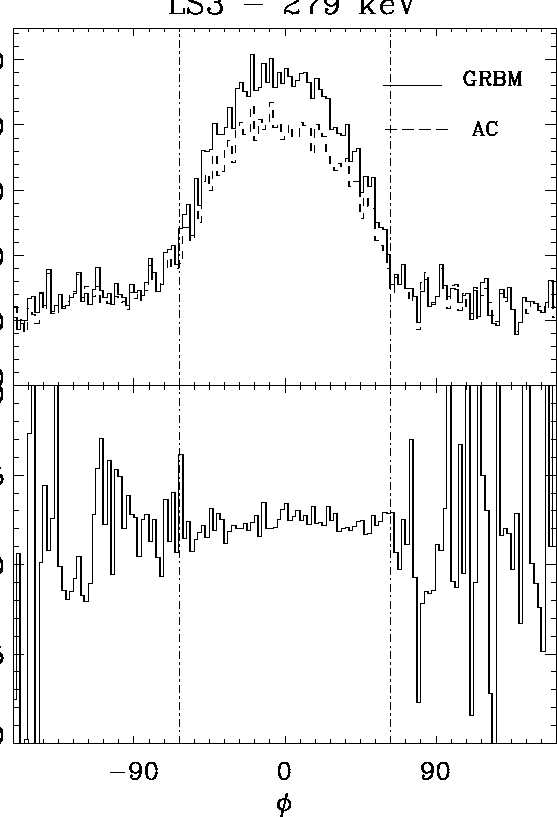
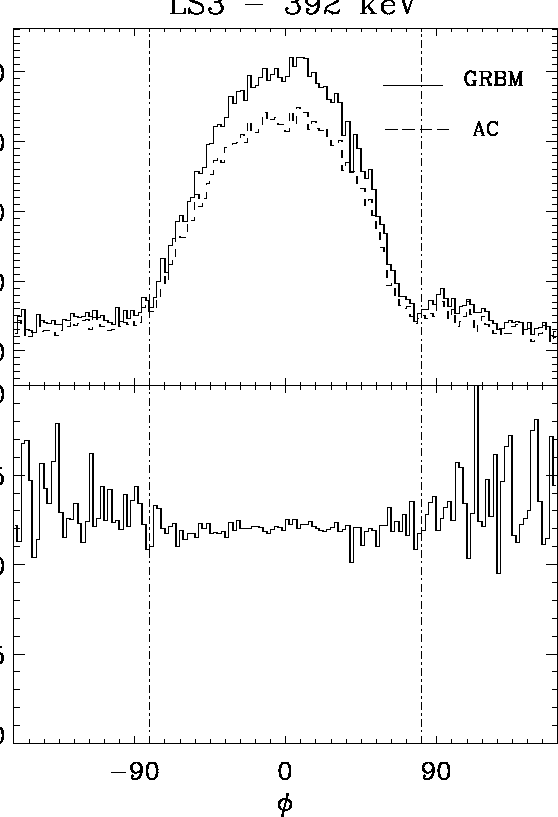
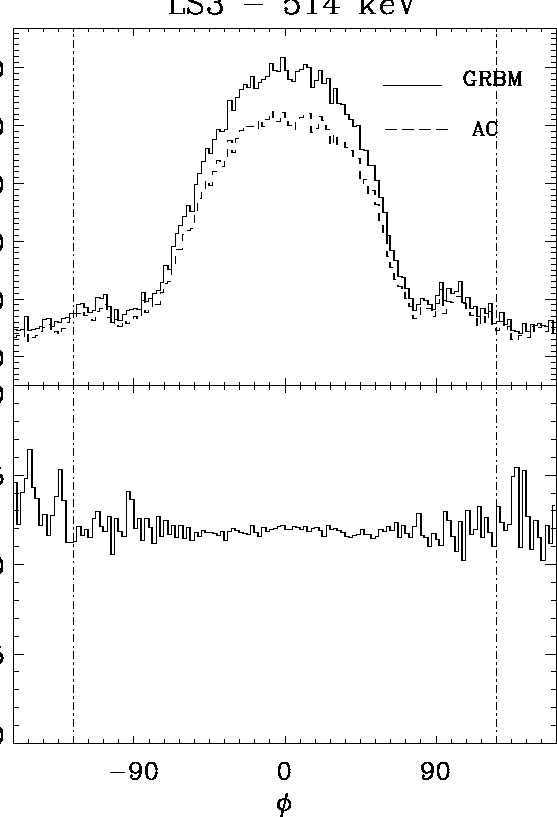
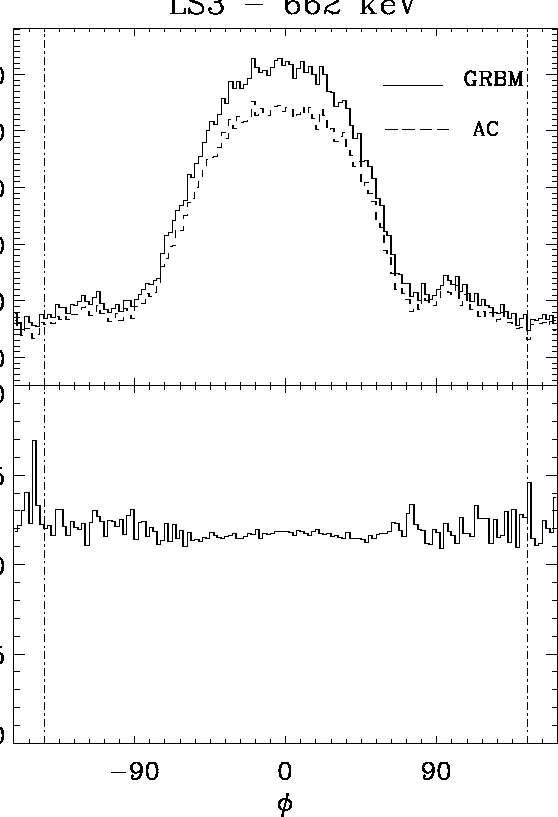
Finally, in figures from 2.15 to 2.21 we plot GRBM and AC light
curves (upper panels) and their ratio (lower panels) for LS3 at
..
Finally, in figures from 2.15 to 2.21 we plot GRBM and AC light
curves (upper panels) and their ratio (lower panels) for LS3 at ![]() =0 and
at the various calibration energies. This last set of figures gives an idea
of the effect of the ACT threshold on the detectors efficiency, effect which in turns depends on the detectors spectral response, as discussed in section 3.1.2.
For the 662 keV measurements we also have an effect due to the
ULT threshold, which cuts part of the photo-peak counts. In each of these
figures two vertical dotted lines indicate the
=0 and
at the various calibration energies. This last set of figures gives an idea
of the effect of the ACT threshold on the detectors efficiency, effect which in turns depends on the detectors spectral response, as discussed in section 3.1.2.
For the 662 keV measurements we also have an effect due to the
ULT threshold, which cuts part of the photo-peak counts. In each of these
figures two vertical dotted lines indicate the ![]() region in which the ratio
between GRBM and AC counts can be well determined without strong statistical
uncertainties (as is outside the region). At 60 keV we obviously have no counts
in the AC band. It is noticeable that as the energy increases the
region in which the ratio
between GRBM and AC counts can be well determined without strong statistical
uncertainties (as is outside the region). At 60 keV we obviously have no counts
in the AC band. It is noticeable that as the energy increases the ![]() range in which the GRBM/AC ratio can be well determined and is nearly constant
enlarges, till reaching nearly the whole field of view at 662 keV. The same
behavior is observed for LS1 and in the elevation range
range in which the GRBM/AC ratio can be well determined and is nearly constant
enlarges, till reaching nearly the whole field of view at 662 keV. The same
behavior is observed for LS1 and in the elevation range ![]() 30
30![]() . This means
that once we have reconstructed the angular/energy responses of LS1 and LS3
in the GRBM band, we can derive the efficiency in the AC band at least in the azimuthal range between
. This means
that once we have reconstructed the angular/energy responses of LS1 and LS3
in the GRBM band, we can derive the efficiency in the AC band at least in the azimuthal range between ![]() 60
60![]() by dividing for
a factor which depends solely on photon energy.
by dividing for
a factor which depends solely on photon energy.
In every figure we plotted the geometrical co-sinus function normalized to the
LS1 counts at ![]() and
and ![]() = 0,
to put in evidence the deviation of detectors responses from the pure geometrical law and make a comparison between the efficiencies of the different shields.
For figures 2.11,2.12,2.13,2.14, the theoretical geometrical shape
has been corrected to account for the elevation angle by multiplying it
by a factor cos
= 0,
to put in evidence the deviation of detectors responses from the pure geometrical law and make a comparison between the efficiencies of the different shields.
For figures 2.11,2.12,2.13,2.14, the theoretical geometrical shape
has been corrected to account for the elevation angle by multiplying it
by a factor cos![]() .All this data refer to counts accumulated over a time period
corresponding to a
.All this data refer to counts accumulated over a time period
corresponding to a ![]() azimuth angle width. Typical 1-sigma error
are plotted in each figure at three
azimuth angle width. Typical 1-sigma error
are plotted in each figure at three ![]() values.
values.
From all these figures it is apparent how the angular responses of LS2 and LS4 are remarkably distorted by the payload instruments and support structures in front of them, while those of LS1 and LS3 are roughly approximated by a simple cosine-like law times an exponential function (see section 3.3.2). Indeed, the latter shields are in front of the support structures of the X-ray optics (LS1 in front of 2 MECS, LS3 in front of one MECS and 1 LECS). These optics are made of nested coaxial mirrors of nickel gold-coated, while their support structures is made of carbon fiber tubes about 2 m long. Each pair of tubes is contained in a 2 cm thick Al box whose width is of the order of that of the shields. This geometry allows a relatively uniform absorption of the radiation entering the field of view of LS1 and LS3. The azimuthal response of LS2 shows clearly the shielding effect of the HPGSPC instrument.
Finally, the angular response of LS4 is strongly distorted by the presence of
WFC1 in front of it (the presence of WFC2 is apparent at negative elevation
angles). The heavy shielding and asymmetry observed in the LS4 angular response
can be directly associated to the camera design. Its stainless steel external structure
causes a strong absorption; for elevation angles ![]() the shadowing effect is due to the gas proportional counter and its
associated electronics, while for angles
the shadowing effect is due to the gas proportional counter and its
associated electronics, while for angles ![]() it is mainly due to the
mask, its support structures and to the square stainless steel camera support.
it is mainly due to the
mask, its support structures and to the square stainless steel camera support.
By considering LS1 and LS3 light curves, we can see that at low energies (60, 122 and 166 keV) the
absorption of the materials in front of the shields discussed above causes the counts to be
below the geometrical co-sinus curve. At intermediate energies (279, 392 keV) the detector response is very close to the co-sinusoidal function, with some excess of counts with respect to the theoretical zero-level at ![]() and
and ![]() . At high energies there is an evident
excess with respect to the geometrical form and the counts (and thus detectors
efficiency) are always above the zero-level in the whole
. At high energies there is an evident
excess with respect to the geometrical form and the counts (and thus detectors
efficiency) are always above the zero-level in the whole ![]() range.
range.
This means that, as confirmed by the energy spectra (see next section), there is a strong contribution to the calibration sources flux from the calibration environment and possibly by other PDS components and satellite instruments and structures. In addition, a fraction of the high energy excess at large ![]() angles may be due to photons crossing one shields and PDS collimators without being absorbed and finally depositing their energy into an adiacent or even the opposite shield.
As discussed in chapter 4, this last effect is also observed in in-flight data,
in which a GRB whose position is very close (within 20 degrees) to one detector axis is also seen, if sufficiently intense and hard, in the two closer shields
and in some cases even in the opposite shield (also if some contribution may well come from source gamma-rays reflection by the outer layers of Earth-s atmosphere).
angles may be due to photons crossing one shields and PDS collimators without being absorbed and finally depositing their energy into an adiacent or even the opposite shield.
As discussed in chapter 4, this last effect is also observed in in-flight data,
in which a GRB whose position is very close (within 20 degrees) to one detector axis is also seen, if sufficiently intense and hard, in the two closer shields
and in some cases even in the opposite shield (also if some contribution may well come from source gamma-rays reflection by the outer layers of Earth-s atmosphere).
In conclusion, these results show that, after estimating and subtracting spurious contributions, an analytical modeling of LS1 and LS3 responses basing on calibration data is possible, while for LS2 and LS4 a satisfactory response description can be obtained only by simulations with the Monte Carlo model.