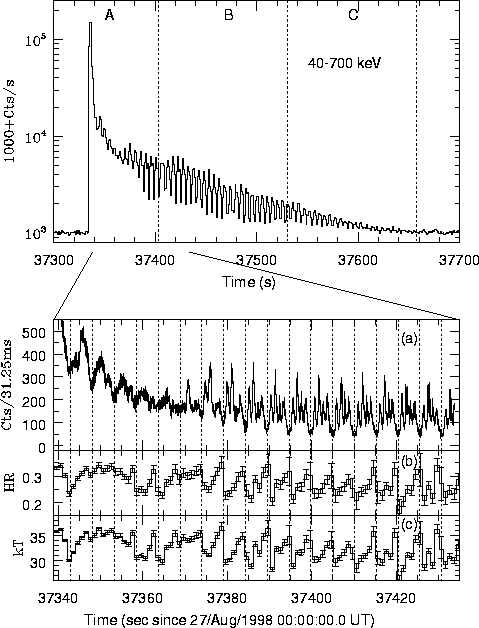
Our results show a complex behavior of SGR 1900+14 in outburst that can be resumed in the following points.
(1) A clear determination of the 5.16 s periodicity
from the onset of the outburst. We note that such a feature is not
detected by the Ulysses experiment suggesting that
the capability to detect the periodicity during this part of the outburst
is related to the bandpass, similarly to the fact that GRBM did not detect
the precursor, while Ulysses did. It is also interesting that we detect
a period consistent with the period measured with ASCA within the
uncertainty in the period determination (0.02 s),
implying that such a large outburst caused a glitch with
![]() .
.
(2) We see a clear transition after ![]() 35 s in the shape of the 5.16-s pulse
profile. At the beginning the pulse is composed of two broad
pulses, with relative
intensity gradually changing from one period to the next one.
At the 6-th pulse from the onset of the outburst the two peaks become
sharper and gradually two additional narrow peaks appear. A striking
feature of these 4 pulses is their equal mutual distance in time and
their phase stability within the 5.16-s period. This feature is
apparent in the PSD as a net enhancement of the n=5 harmonic with respect
to the others, corresponding to a periodicity of
35 s in the shape of the 5.16-s pulse
profile. At the beginning the pulse is composed of two broad
pulses, with relative
intensity gradually changing from one period to the next one.
At the 6-th pulse from the onset of the outburst the two peaks become
sharper and gradually two additional narrow peaks appear. A striking
feature of these 4 pulses is their equal mutual distance in time and
their phase stability within the 5.16-s period. This feature is
apparent in the PSD as a net enhancement of the n=5 harmonic with respect
to the others, corresponding to a periodicity of ![]() s.
It looks like the 5.16-s periodicity in this part of the outburst
is basically due to the lack/occultation of the 5-th peak that one
would have expected in correspondence of the 5.16-s dip. The
occurrence of such a 5-th peak would have resulted in the
disappearance of the 5.16-s periodicity.
s.
It looks like the 5.16-s periodicity in this part of the outburst
is basically due to the lack/occultation of the 5-th peak that one
would have expected in correspondence of the 5.16-s dip. The
occurrence of such a 5-th peak would have resulted in the
disappearance of the 5.16-s periodicity.
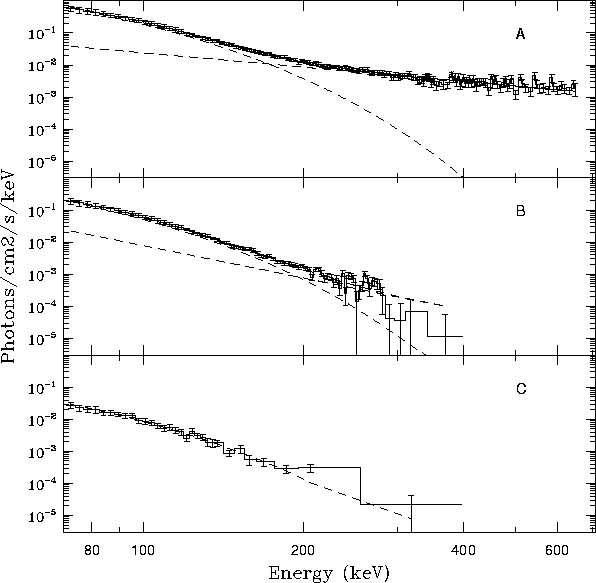
(3) The determination of a complex spectral evolution showing a very
hard initial outburst pulse followed by softer emission
(parameterized with an OTTB with kT![]() keV) that is
strongly modulated in agreement with the periodic pulse structure.
We notice a `see-saw' behavior of the HR, with the highest hardness
in correspondence of the dips of the light curve. If the dip
would be due to an occultation this would imply that a
persistent hard component is present in the emitted spectrum.
A hard component is also suggested by the
persistence for hundreds of seconds of a PL spectral
component additional to the single OTTB
(see Fig. 5.21, top and middle panel).
keV) that is
strongly modulated in agreement with the periodic pulse structure.
We notice a `see-saw' behavior of the HR, with the highest hardness
in correspondence of the dips of the light curve. If the dip
would be due to an occultation this would imply that a
persistent hard component is present in the emitted spectrum.
A hard component is also suggested by the
persistence for hundreds of seconds of a PL spectral
component additional to the single OTTB
(see Fig. 5.21, top and middle panel).
(4) Finally, we note that the decay of the event light curve as detected
by the GRBM is well approximated by a double exponential law and
cannot be described by a power law ![]() as derived for the Ulysses light curve. Also this
difference is likely to be ascribed to the different Ulysses-BeppoSAX/GRBM
band passes.
as derived for the Ulysses light curve. Also this
difference is likely to be ascribed to the different Ulysses-BeppoSAX/GRBM
band passes.
The emerging picture is that of a complex phenomenon, involving a highly non-trivial response of a compact object, most likely a highly magnetized neutron star with a structured emitting region, to a major explosive event. Our point no. 2 is worth of special attention. The emitting region surrounding the compact object is first subject to a violent readjustment following the initial strongly super-Eddington outburst (possibly related to a relativistic ejection producing transient radio emission). Subsequent evolution and settling of the 1-s periodic feature reveals a highly structured emitting region with the excitation of higher order, possibly resonant oscillating modes. In particular, the strong enhancement of the fifth harmonic that we observed is unprecedented among SGR strong outburst detections. Trapping in a magnetosphere of emitting `blobs' co-rotating with the surface of a neutron star, or having their proper oscillation mode, might explain the harmonic content of the time variable power spectrum of SGR 1900+14.
 |
 |