GRB 990123 - Loiano observations
GRB 990123

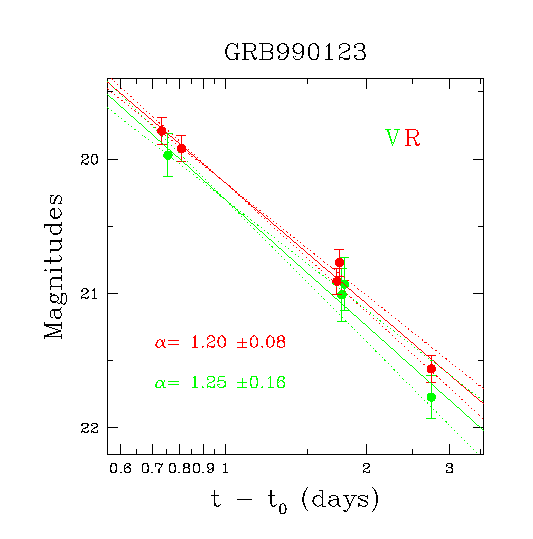
Figure 1: Light curves of the optical transient of GRB990123 in
V and R bands taken at the
Bologna Astronomical
Observatory
1.5m telescope
(Masetti et al. 1999,
GCN 233). Superposed
are the best-fit temporal
power-law curves (solid) along with 1-sigma uncertainty ranges (dashed)
for the R and V bands. t0 corresponds to 1999 January 23.4078 UT.

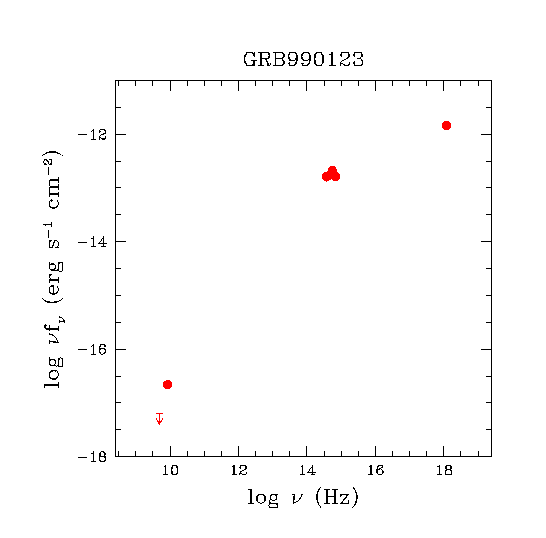
Figure 2: Spectral energy distribution of GRB990123.
The optical data (see Masetti et al. 1999,
GCN 233 and Fig. 1)
refer to the first night of observation (January 24.16 UT) and are
dereddened with E(B-V) = 0.016 (Gal et al. 1999,
GCN 207).
The X-ray point (Heise et al. 1999,
IAU Circ. 7099)
is simultaneous to the optical data. The radio point and upper limit
(Frail et al. 1999, GCN
211; Galama et al. 1999,
GCN 212)
were taken on January 24.65 and 24.28, respectively. Error bars are
smaller than or equal to the symbol size.
GCN Circular no. 233
GRB 990123 BVRI Photometry
N. Masetti, E. Palazzi, E. Pian, F. Frontera (ITESRE-CNR, Bologna), C.
Bartolini, A. Guarnieri, A. Piccioni (Astronomy Dept., Univ. Bologna),
G. Valentini (Teramo Astr. Obs.) and E. Costa (IAS-CNR) report:
We have imaged the field of GRB990123 with the Bologna Astronomical
Observatory 1.5m telescope equipped with BFOSC, using Johnson B and V, and
Cousins R and I filters in January 24-26.
Calibrations were done referring to
GCN 206 for the B
image, to GCN 204
for the R image, and using the standard star BD+252534 (Taylor et al.
1989, AJ 97, 1798) for the V and I images.
In the appended table the preliminary magnitudes of the optical transient
(GCN 201) are
reported along with the observation dates.
Power-law fits to the R and V band data yield temporal decay indices of
alpha = 1.20 +- 0.08 and alpha = 1.25 +- 0.16, respectively (errors are 1
sigma), with satisfactory chi square values. No indication is found of a
flattening of the light curve due to an underlying galaxy.
Suggestion of a slight flux increase is seen on January 25 in
both R and V bands, as opposed to the overall fading trend. This is
however not significant.
The BVRI spectral continuum of the optical transient in the first night
(average time of Jan 24.16), dereddened with E(B-V) = 0.016
(GCN 207), has
a power-law shape (f_nu = k*nu^{-beta}) with best-fit slope
beta = 1.1 +- 0.2 (1 sigma).
The BVRI light curves and the radio-to-X-ray spectral energy distribution
of the transient are also shown at the Web site
http://tonno.tesre.bo.cnr.it/~masetti/grb990123.html
Multiwavelength observations, particularly in the near-infrared and
millimetric bands are needed and urged.
      Date (UT)     mag   error  band
  -----------------------------------
  1999 Jan 24.122  19.36  0.20    I
           24.142  19.79  0.10    R
           24.164  19.97  0.16    V
           24.194  20.64  0.07    B
           24.216  19.92  0.10    R
           25.138  20.91  0.10    R
           25.159  20.77  0.10    R
           25.181  21.01  0.20    V
           25.203  20.93  0.20    V
           26.154  21.77  0.16    V
           26.154  21.56  0.10    R
This message can be cited."
The BeppoSAX-GRB team in Bologna
 Back to Nicola Masetti's Home Page
![[Home]](/Gif/pesce.gif) Back to Tonno
Home Page
Back to Tonno
Home Page


![[Home]](/Gif/pesce.gif) Back to Tonno
Home Page
Back to Tonno
Home Page